Kansas City’s Lost Great Society Transit Plan
Lyndon Johnson’s Great Society domestic agenda featured many progressive spending programs, including the creation of the Urban Mass Transit Administration (now the Federal Transit Administration). This legislation funded the development of regional metro systems in the San Francisco-Oakland Bay Area (BART), Washington, DC (WMATA), and Atlanta (MARTA). It also funded many regional transit plans, including one in Kansas City. I recently found a copy of the final report of this plan, developed by MARC and a joint venture of consulting firms, Parsons-Brinckerhoff (now WSP) and HNTB. You can see a copy of the plan that I scanned at the KC Library Missouri Valley Room here. The plan was developed using public funds and is available to view in the library, so I’m assuming there aren’t copyright issues posting it here. If you work for a public agency and have access to other materials (appendices, technical memos, etc.), feel free to share them by sending me an email at hello@joshboehm.xyz.
The 1975 Long Range Transit Plan cost around $1 million, or around $6.5 million in current dollar terms. By contrast, the 2017 Smart Moves 3.0 plan was funded by a grant of about $500,000. This plan is a delight to read through. It’s also painful to think about the Kansas City that could have been. This planning effort started in a period where Kansas City was really in its prime. While sprawling, it was making major investments in the airport, stadiums, and other facilities and growing at a fast clip. If implemented, this plan would likely have changed the trajectory of sprawl and automobile dependency that Kansas City was on, or at least balanced out those forces. Based on some figures in the report, daily transit ridership in the region was about 60,000 trips per day. As of June 2023, Kansas City has recovered to its pre-pandemic ridership – but that’s only about 35,000 trips per day. This plan forecast as many as 323,600 trips per day – nearly 10 times our current transit ridership. You’d be right to be skeptical of ridership forecasts and projections. However, as you unpack the details of the plan and the sheer amount of service that was proposed, those numbers are believable.
What was in the Plan?
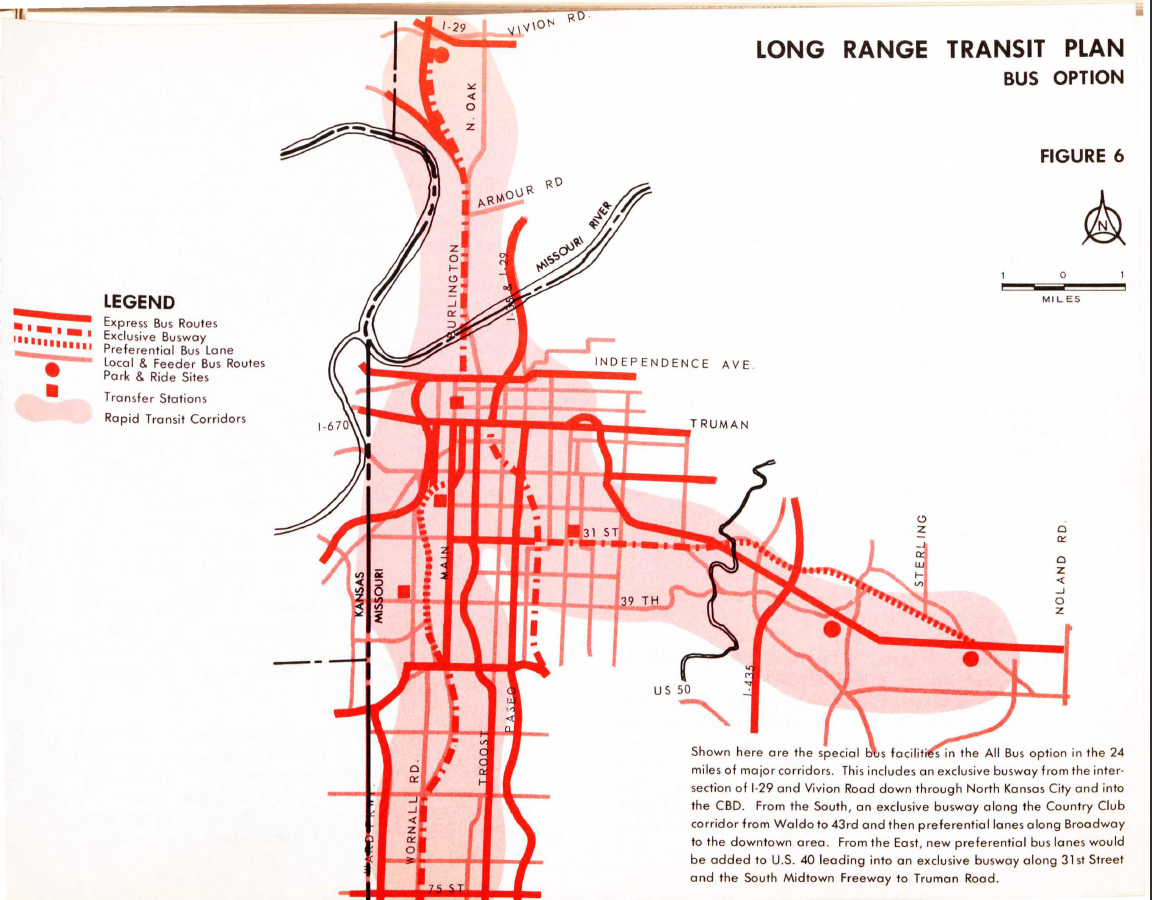
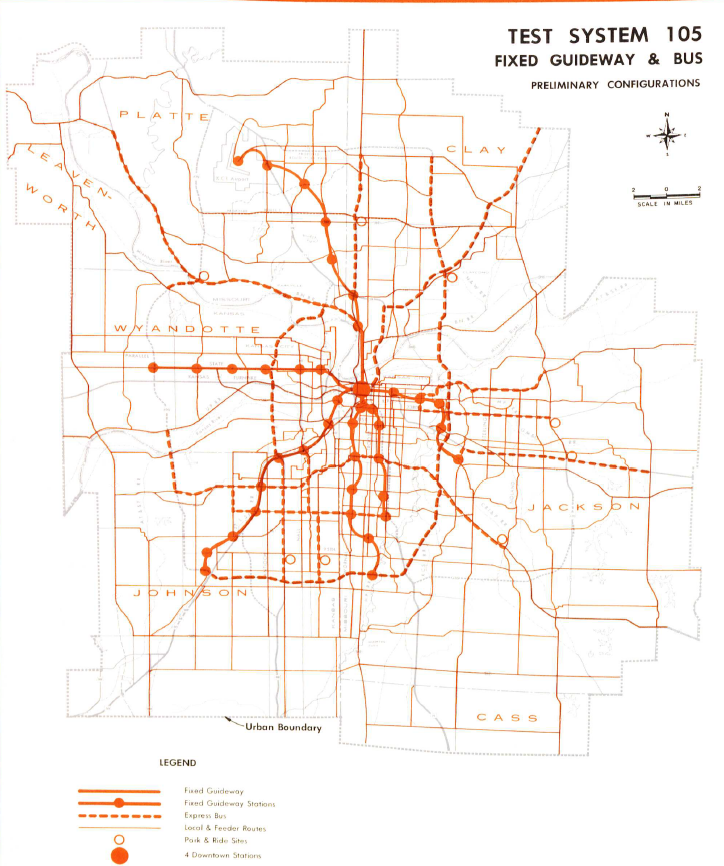
The final plan presented two options: an all-bus network and a bus network with an express metro system operating in dedicated right-of-way. Neither plan was meaningfully implemented, although the routes and networks are still relevant to today’s transportation planning context. In both scenarios, there were around 1,300 hundred miles of transit service in five counties, with an impressive amount of service. Major fixed guideway routes would have seen 10 minute mid-day headways and 5-minute peak hour headways – service that would delight transit riders today.
Core Fixed Guideway Service
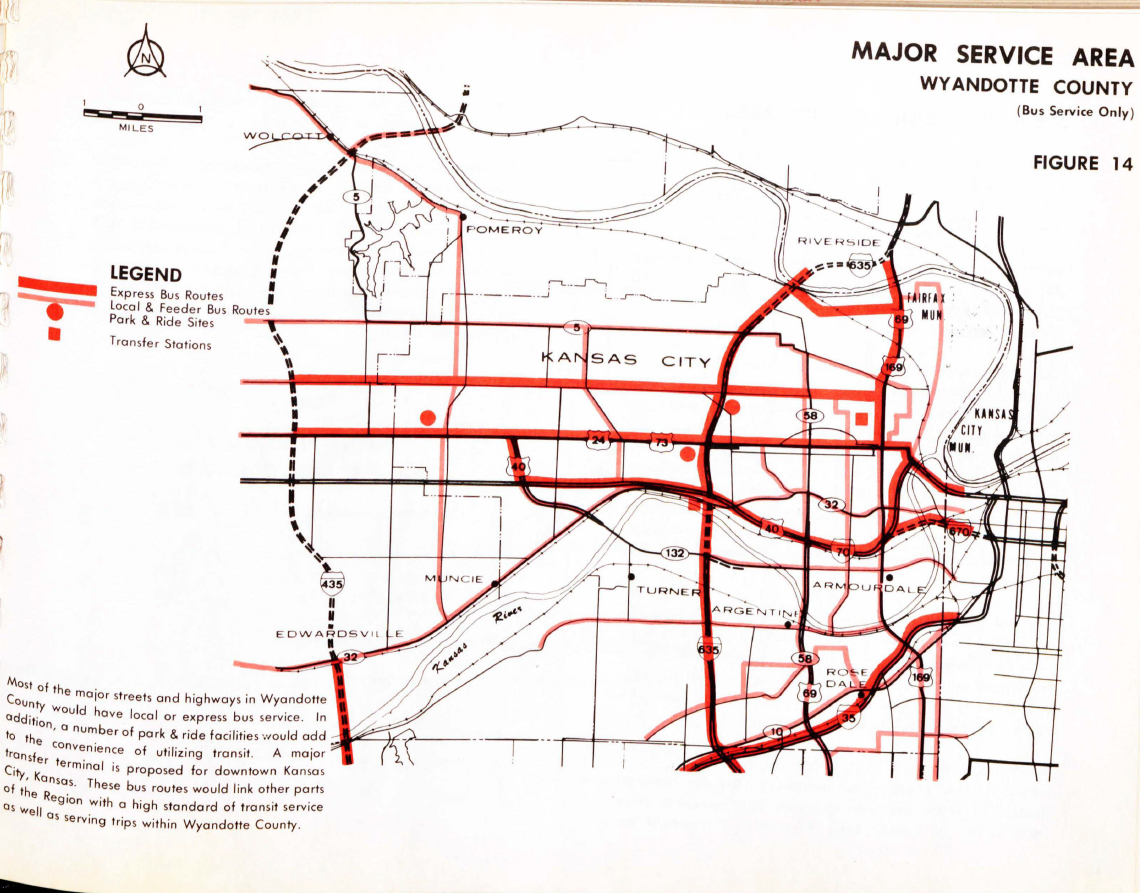
Consistent between both plans was the focus of special facilities in three corridors focused mostly in Kansas City, Missouri:
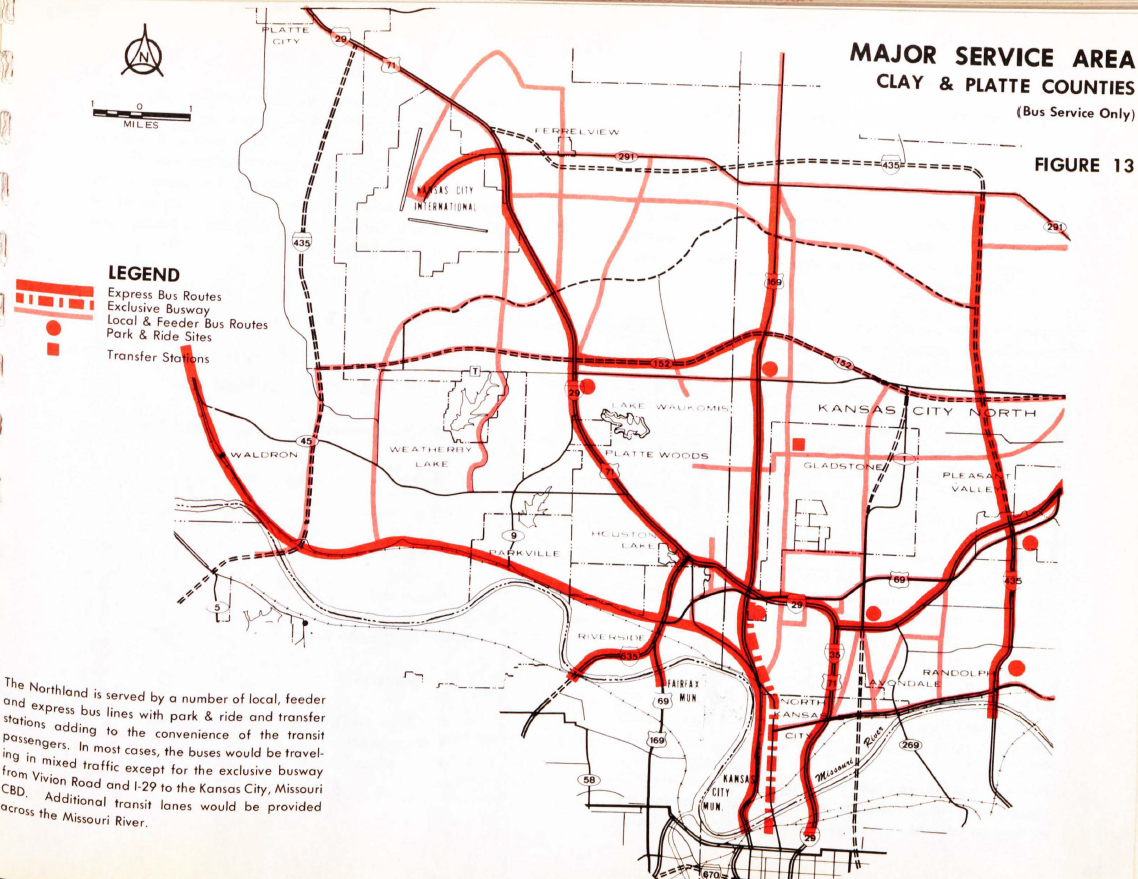
- North from Downtown to Vivion Road
- South from Downtown to Waldo at 75th Street
- East from Downtown to the Blue Ridge Mall.
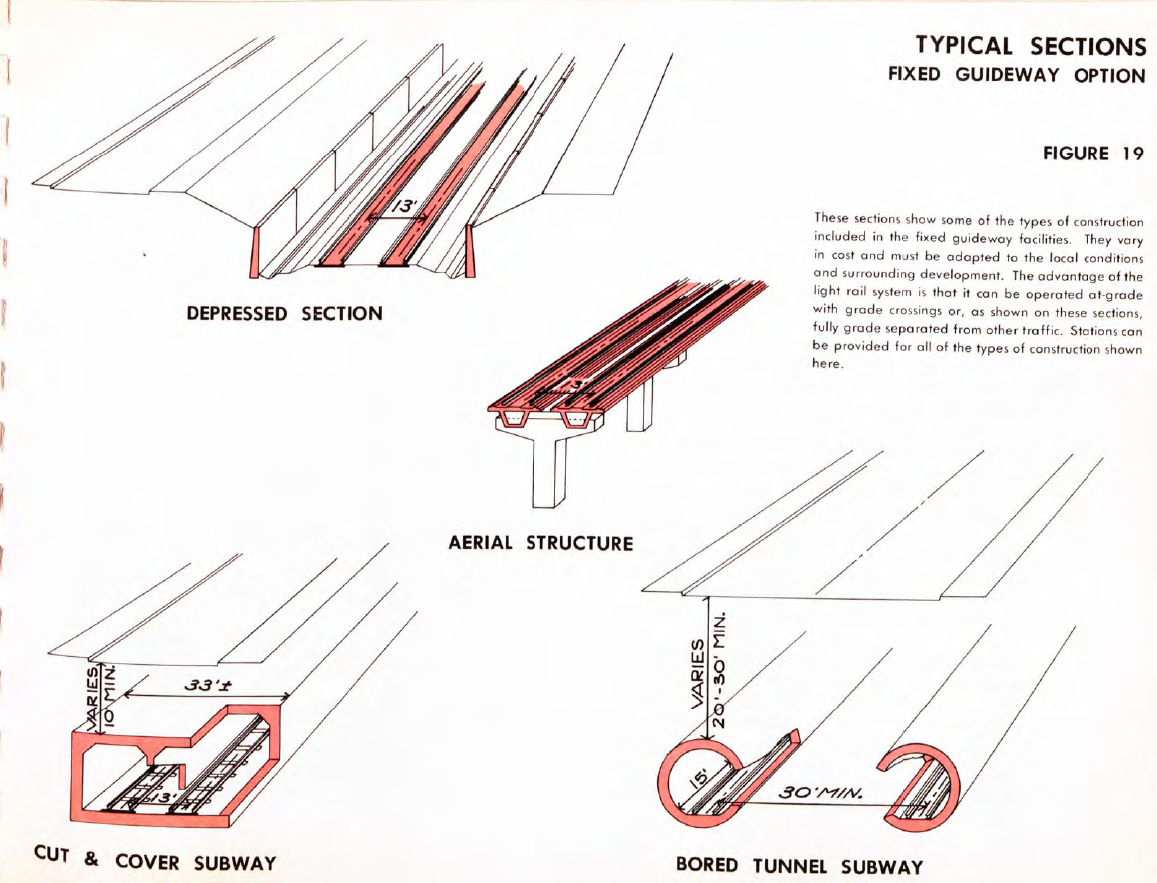
The fixed guideway rail option proposed a light rail vehicle operating in a 24 miles of completely exclusive guideway, including 5 miles of subway and 3 miles of aerial structures. It aimed to compete with driving travel times, offering a 9-minute trip between Vivion Road and Downtown, a 17-minute trip between Downtown and 75th Street, and a 15-minute trip between Downtown and the Blue Ridge Mall. While the plan uses the word “light rail”, I think it’s very clear that this would have been different than most light rail as we know it today. It would have been a bit more like a light metro system with fast-moving vehicles and frequent headways.
The north-south alignment would run from Vivion Road around US-169, head south in exclusive right-of-way until it got to Burlington, and run in an elevated structure down Burlington Road, crossing the river West of the ASB bridge (which Burlington used at the time) on a new structure (what would become the Heart of America Bridge). The guideway would continue in a bored subway tunnel under Walnut starting at 2nd street, travel through the Crossroads in an open cut west of Walnut (resulting in the demolition of basically all of the buildings on the west side of Walnut) to Union Station and Crown Center. It would then operate in a tunnel through Penn Valley Park and continue as a subway under Broadway running until 43rd Street, where it would intersect the Country Club Right-of-Way. The route would follow the Country Club Right-of-Way all the way to Waldo, with grade separations at major streets.
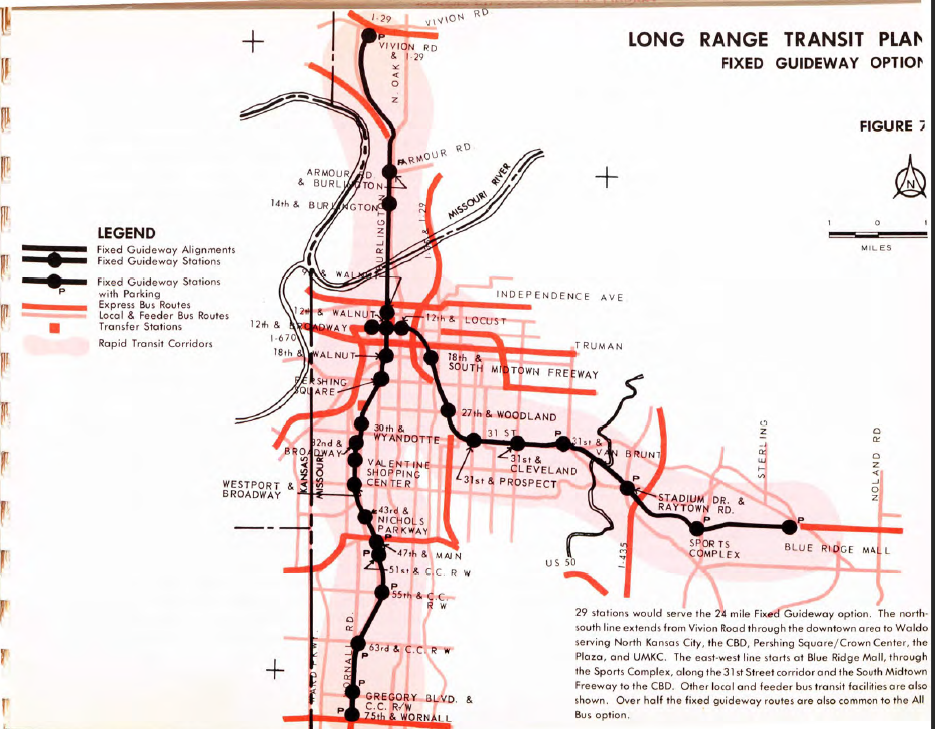
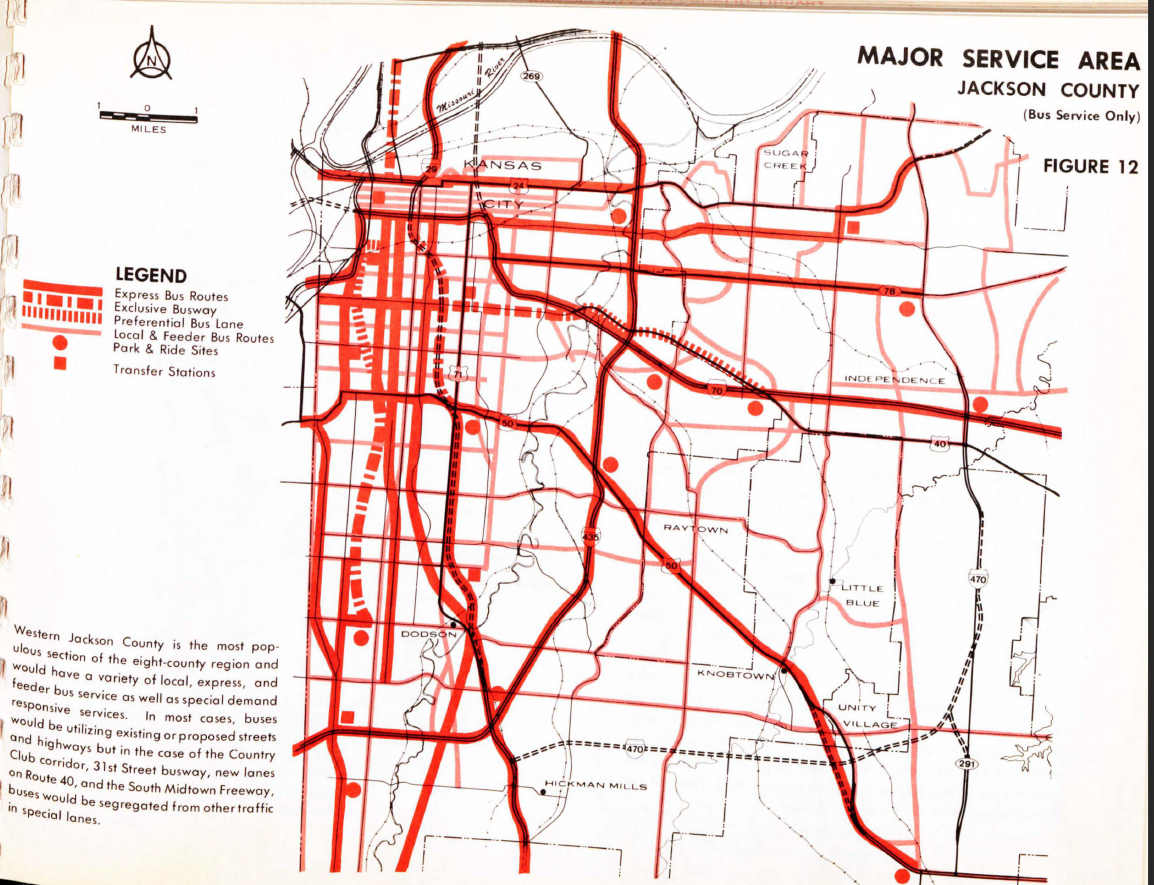
The east-west alignment would run from Blue Ridge Mall to downtown. It would operate in the I-70 Right-of-Way, with a stop at the Truman Sports Complex. The line would use the Rock Island Railroad (through Leeds) east toward 31st and Van Brunt, and would follow 31st Street in an open cut to the then-proposed South Midtown Freeway (US-71 highway), where it would then operate in the highway median to 12th Street in a cut-and-cover tunnel all the way to Broadway, where the new convention center had been built.
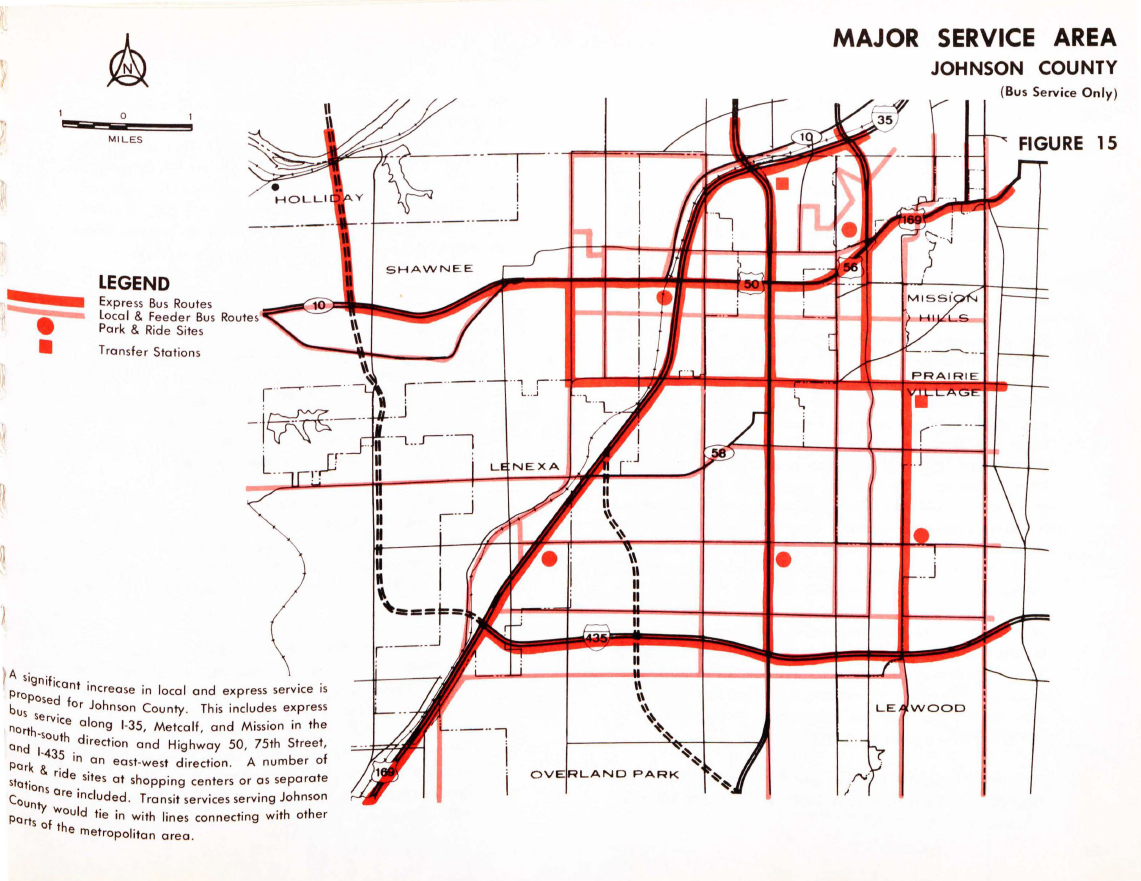
Local and Express Bus Service
One of the really impressive things about this plan is how much additional bus service it included. The system would have covered 85% of the region’s population and 90% of the region’s jobs (in 1970) within a quarter mile of transit. The plan also claimed that 75% of the region’s population and 78% of the region’s jobs in the year 2000 would be within walking distance of transit, based on future land use projections. The frequency of the service was also impressive. Where the Smart Moves 3.0 defines “Fast and Frequent” service as 15-minutes or better, base headways of the fixed guideway routes would have been every 10 minutes throughout the day and every 5 minutes in the peak hour. Even suburban and express bus services had 15-minute peak-hour frequencies. Today, the KC Streetcar is the only transit option that comes close to those headways.
It would be interesting to plot these routes against actual job locations in 2000 to see just how accurate this forecast was. Of course, we’ll never know since investments in fixed guideway could have radically altered the region’s growth.)
| Service | Peak Hour | Base (Mid-Day) |
Balance (Owl & Evening) |
|---|---|---|---|
| Fixed Guideway | 5 min | 10 min | 15 min |
| Express Bus | 15 min | 30 min | |
| Urban Local | 10 min | 20 min | 30 min |
| Suburban Local | 15 min | 60 min |
| Service | Jackson | Clay and Platte | Wyandotte | Johnson | Total |
|---|---|---|---|---|---|
| Local | 458 | 218 | 134 | 175 | 985 |
| Express | 164 | 86 | 46 | 62 | 358 |
| Busway | 10 | 6 | 0 | 0 | 16 |
| Preferential Lane | 19 | 0 | 0 | 0 | 19 |
| Fixed Guideway | 0 | 0 | 0 | 0 | 0 |
| Total | 622 | 304 | 180 | 237 | 1,343 |
| Service | Jackson | Clay and Platte | Wyandotte | Johnson | Total |
|---|---|---|---|---|---|
| Local | 458 | 215 | 134 | 175 | 982 |
| Express | 133 | 81 | 46 | 62 | 322 |
| Busway | 2 | 0 | 0 | 0 | 2 |
| Preferential Lane | 6 | 0 | 0 | 0 | 6 |
| Fixed Guideway | 19 | 5 | 0 | 0 | 24 |
| Total | 610 | 301 | 180 | 237 | 1,328 |
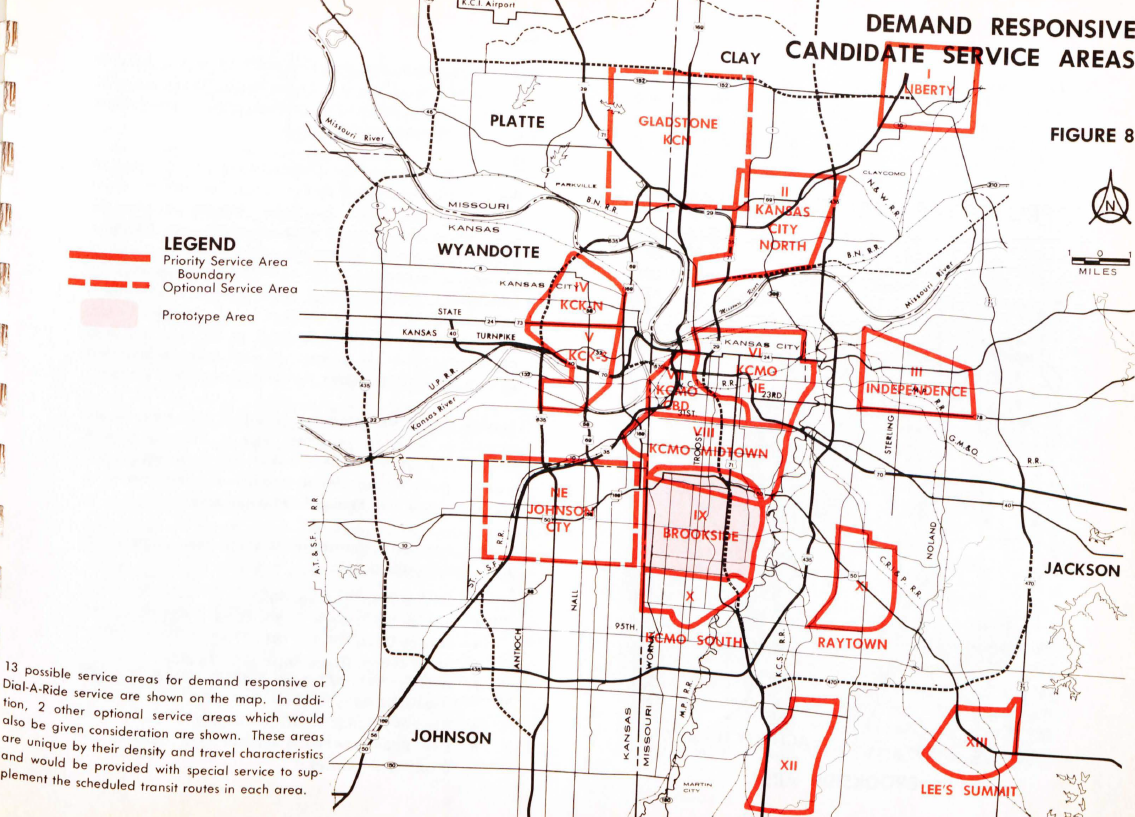
Demand Response Services
Demand Response transit isn’t new either. Today’s IRIS service, as well as Microtransit in Johnson, Wyandotte, and Leavenworth counties, are modern versions of a type of service that has existed for a long time. These services would have be connected to fixed route services and circulated throughout multiple zones connecting to those fixed routes. While the buses would follow a typical route, they could deviate from that route by 3 or 4 blocks to pick up people requesting a ride. At the time it was understood that these services would be expensive but beneficial in serving areas that couldn’t be well-served by traditional fixed routes. Decades before the Americans with Disabilities Act required complementary paratransit, it was also understood that this service would be helpful to people with disabilities.
Project Costs in Context
While the construction cost of the fixed guideway system was high at $610.4 million, the plan pointed out the costs of other major projects at the time. KCI was built for $339 million, Crown Center cost $248 million, the Truman Sports Complex cost around $90 million. The plan doesn’t make mention of the cost of Kansas City’s highway system. I haven’t seen a full retrospective accounting of what it cost to build regionally, but the City Plan Commission’s 1951 Expressways report put the cost in Kansas City, Missouri around $129 million in 1951 dollars. That would have been at least $264 million in 1975 dollars, and there were probably cost overruns that would have made those costs even higher than intially estimated in the Expressways report. But the 1970s were also a new era in terms of construction standards, especially for brand new transit systems with lots of unknowns and little economy of scale. So, yes, the $610 million plan ($3.5 billion plan today) was ambitious, but the Kansas City region was no stranger to ambition at that time.
Limits of Rational Planning
This plan was peak rational planning. With more than $6.5 million in professional services fees from the Federal government, there was no shortage of resources to do thorough quantitative and engineering-based exercises over multiple years (I think starting as early as 1971). The rational planning model has a strong preference for the quantitative and measurable, and you’re likely to see benefit-cost analysis to guide a final recommendation.
The rational planning model follows this basic process:
- Defining challenges or goals,
- Developing future alternatives,
- Evaluating alternatives against the goals,
- Implementing the plan,
- Measuring outcomes, and
- Repeating the process in response to changing conditions.
I truly do admire the logic of the rational planning model. In a closed system without outside political or economic forces, or lots of pesky human beings with their own ideas or “irrational” behavior, the model seems to make a lot of sense. But this process can be limiting and ineffective, especially in the face of strong political headwinds. While the plan did feature a great deal of community engagement – over 150 presentations to various civic and neighborhood groups, it seems to stick its head in the sand when faced with political challenges.
Growth Projections
Probably the most futile thing planners do is attempt to project future population growth multiple decades. In the case of this plan, planners attempted to develop a regional forecast for the year 2020 – 30 years from the 1970 census. The population of the 8-county metropolitan region (at the time the metro area was 8 counties; today it’s 14) was around 1.3 million in 1970 and projected to grow to 2 million by 2020. There were two scenarios for growth – one continuing a recent trend of sprawling suburban development, and another showing more moderate growth on the suburban fringe, as well as a moderate amount of growth in the region’s core. Both scenarios turned out to be wrong – both in terms of the overall amount of growth as well as the location of that growth.
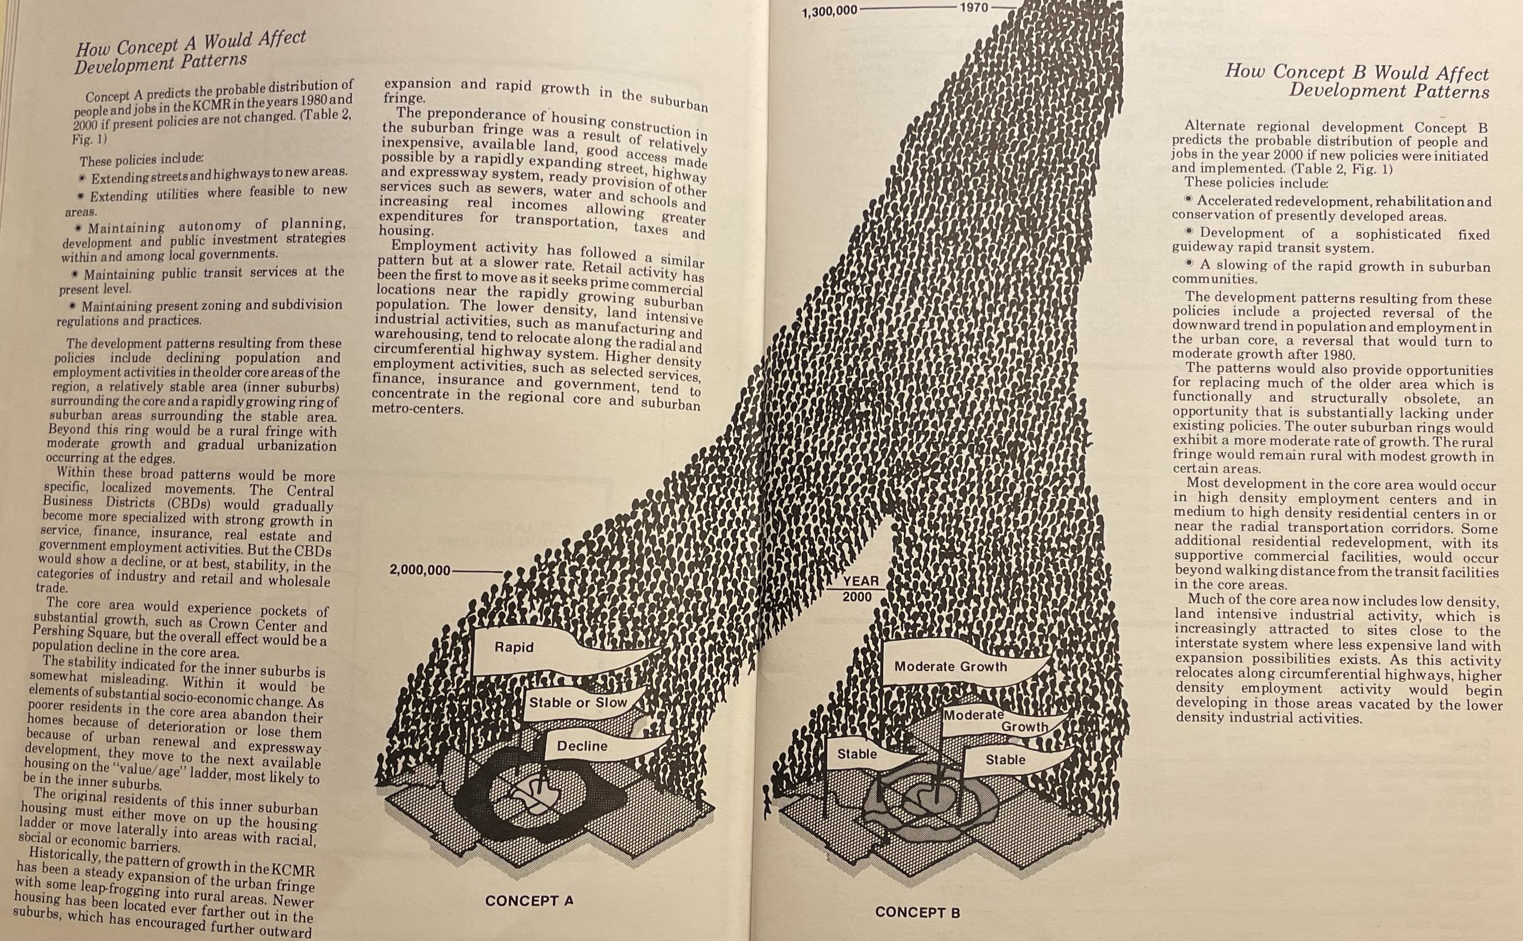
The 8-county area metro as defined in 1970 only reached a population of about 1.7 million in 2000. It wouldn’t be until 2020 that this equivalent area reached a population of 2 million. The region’s predicted growth rate was nearly double the actual growth rate. In fairness to the planners at the time, this was a significant slowdown from the region’s growth in previous years.
| Area | 1970 Actual | 2000 Sprawl | 2000 Infill | 2000 Actual | 2020 Actual |
|---|---|---|---|---|---|
| Leavenworth | 53,340 | 71,056 | 67,751 | 68,691 | 81,881 |
| Wyandotte | 186,845 | 267,304 | 267,921 | 157,882 | 169,245 |
| Johnson | 220,073 | 397,640 | 400,328 | 451,086 | 609,863 |
| Platte | 32,081 | 103,266 | 92,297 | 73,781 | 106,718 |
| Clay | 123,702 | 279,207 | 264,915 | 184,006 | 253,335 |
| Jackson | 654,178 | 782,324 | 811,395 | 654,880 | 717,204 |
| Cass | 39,448 | 76,529 | 72,719 | 82,092 | 107,824 |
| Ray | 17,599 | 22,674 | 22,674 | 23,354 | 23,158 |
| Region Total | 1,327,266 | 2,000,000 | 2,000,000 | 1,695,772 | 2,069,228 |
| Regional Core | 233,268 | 187,175 | 246,885 | 134,564 | 138,240 |
It’s easy to understand how planners could have made this mistake. Kansas City really seemed to peak at that point. KCMO reached its peak population (it didn’t reach that point again until 2020) in 1970. It was the 26th largest city (now it’s the 37th) in the country. KCI, the Truman Sports Complex, Crown Center, Bartle Hall, and Kemper Arena would all be built in this decade. There were significant large corporations that were philanthropically engaged in the region’s future. There also weren’t many signs that growth would take off in Johnson County to the extent that it did. Johnson County (and to a very small degree Cass County) were the only places to over-perform their population growth forecasts.
The Regional Core – defined in this study as as the area bounded by the North Kansas City, MO City Limits on the north, 55th street on the south, Prospect Avenue on the east, and 18th Street on the west, also took a hit. Under the sprawl scenario it was forecast to lose population at an annual rate of about 0.7% per year, and under an infill scenario it was expected to grow at an annual rate of about 0.2% per year. It declined at twice the rate of the sprawl scenario, or about 1.4% per year. The urban core lost nearly 100,000 people in the period between 1970-2020, far more than either forecast predicted. In the period 2000-2020, sprawl seems to have decelerated and infill growth in the regional core area (as defined here) has improved somewhat. The regional core area grew by about .14% per year (albeit only 4,000 new residents, and still lower than the optimistic infill scenario of .2% per year). The metropolitan region (as defined in the 1975 study) also grew at a slightly faster rate during this period – 1.1% rather than 0.9%.
| Area | 2000 Sprawl Scenario |
2000 Infill Scenario |
1970-2000 Actual Rate |
2000 - 2020 Actual Rate |
|---|---|---|---|---|
| Leavenworth | 1.11% | 0.90% | 0.96% | 0.96% |
| Wyandotte | 1.44% | 1.45% | -0.52% | 0.36% |
| Johnson | 2.69% | 2.73% | 3.50% | 1.76% |
| Platte | 7.40% | 6.26% | 4.33% | 2.23% |
| Clay | 4.19% | 3.81% | 1.62% | 1.88% |
| Jackson | 0.65% | 0.80% | 0.00% | 0.48% |
| Cass | 3.13% | 2.81% | 3.60% | 1.57% |
| Ray | 0.96% | 0.96% | 1.09% | -0.04% |
| Region Total | 1.69% | 1.69% | 0.93% | 1.10% |
| Regional Core | -0.66% | 0.19% | -1.41% | 0.14% |
I think this speaks to an interesting point about regional growth and the impact of forecasts. Planners and policymakers often treat a region’s growth rate as mostly dependent on external factors, and not related to or dependent on regional policy or the geographic distribution of growth within the region itself. In my view, Kansas City’s stagnation was caused at least as much by political economy internal to the region as it was by external factors. In this period, if Kansas City had been as committed to growing its core more than its periphery, the region would have had an increased level of economic productivity and cultural magnetism that set it on a higher growth trajectory than it really experienced.
Political Context
The final plan ultimately recommended a very reasonable system of public transit that would have been an amazing asset to our region. Rather than a costly splurge on a dedicated fixed guideway system, the plan recommended a much smaller capital program. Yet despite its reasonableness, the plan was not implemented. I believe these are some of the factors behind this failure.
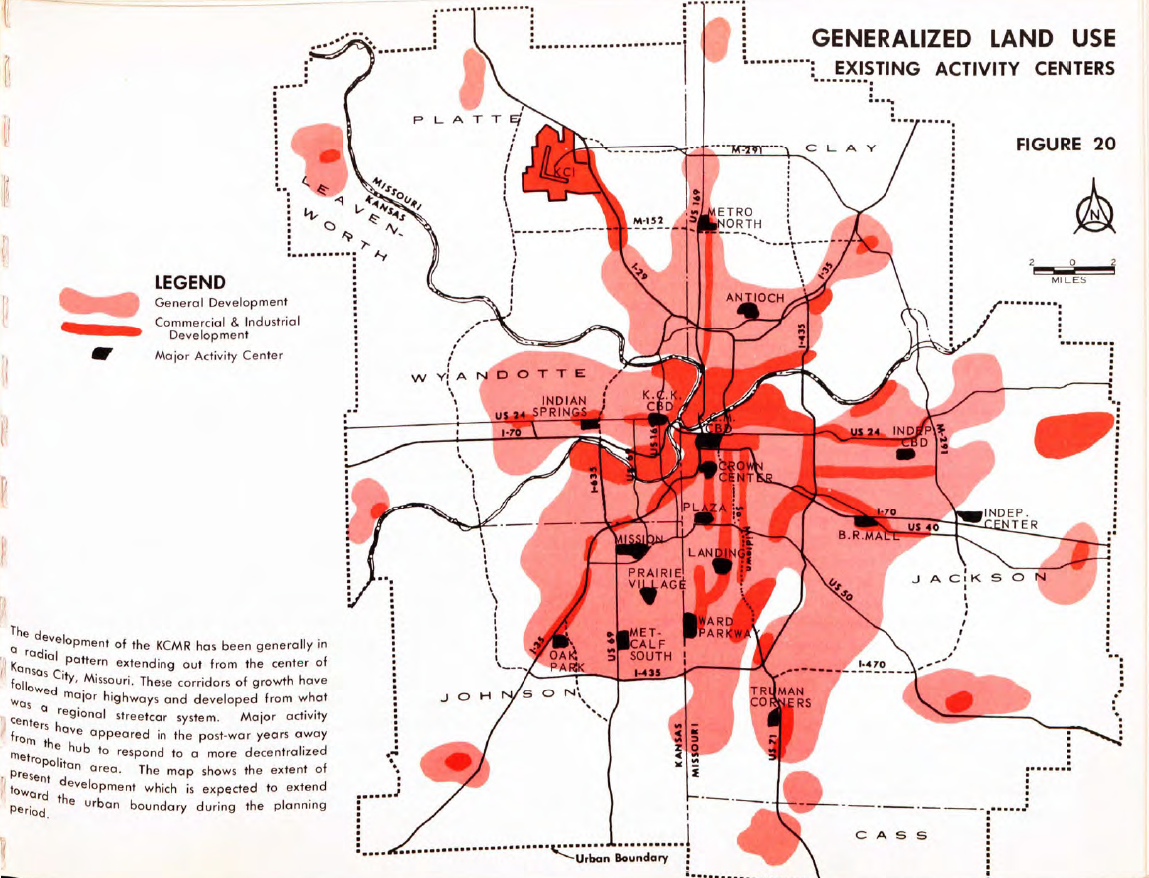
Sprawl: The plan acknowledges sprawl (“the process of decentralization”), and the difficulty of establish a transit market with a weaker central business district. The region had shifted from one focused on the Central Business District to one with many regional activity centers of varying magnitude. I think this approach generally helps an MPOs keep the peace between warring taxing jurisdictions, where there is generally a great deal of mistrust between the central city and suburbs. In this model, city and suburb are equivalent in their value and importance to the region. White flight isn’t the cynical and intentional exploitation of the racist seeds planted in a middle class but a matter of personal preference – the free market at work. This model may have kept the peace between suburbs and the central city. But it didn’t help promote equitable or sustainable land use patterns that would have allowed transit to thrive.
A proposed joint development program (what we could call Transit-Oriented Development today) – seems like it could have made a bit of a difference and been a good demonstration program, although if you dive into the details there are a couple of red flags around property acquisition and demolition, showing that the professional class hadn’t really shifted its problematic mindset on things like urban renewal.
Meanwhile, the Mid-America Regional Council had also engaged the Brookings Institute to comment on the region’s future. A brief Star article characterized the outside expert’s take: past investments had already set the region on its sprawling trajectory. While the article mentioned the consequences of that development pattern, you don’t get a sense that anything could be done about it.
Energy Crisis: There were multiple energy crises in the 1970s, including one in 1973-4 during the plan development. The plan mentions a 9% increase in ridership related to the gasoline shortage. There is an entire section on energy requirements of transportation. Mayor Wheeler predicted that the energy crisis would materialize in 3-4 years and dramatically reduce driving, leading to more demand for transit. But fuel shortages eventually faded from memory. It’s still yet to be seen whether concerns about climate change are able to drive momentum that the energy crisis wasn’t able to do. Fuel shortages were tangible but acute. But the constant grind of climate change might be a stronger motivator in this era than acute energy price hikes.
From Great Society to Austerity: Richard Nixon resigned in 1974, one year before this plan was finalized. Despite the photos of him marveling at BART, I don’t believe his administration was kind to the Great Society transit mission. Meanwhile, inflation and local fiscal crises were starting to ripple through the economy. New York City, burdened with heavy debt loads, was denied an essential bailout by Congress and President Gerald Ford, leading to an age of austerity for the city. Meanwhile, BART and WMATA struggled with budget and operational challenges that made headlines. The mood for ambitious progressive projects soured throughout the country right as Kansas City’s plan was being finalized.
That doesn’t mean there weren’t significant investments being made in transit at the time. The 1974 Urban Mass Transit Act renewal had a substantial increase in funding, including for the first time Federal assistance to pay for operations, not just capital. At the same time, this assistance was likely too little, too late for the issues that highway building and sprawl had caused for transit systems around the country.
A politically fractured region: Searching for newspaper articles surrounding the planning process shows that the region wasn’t in agreement about its transit future. While consultants were recommending a bus system, there seemed to be a local preference for a fixed guideway. One article quotes Joel Pelofsky, the City Council person for the Country Club district, who noted a strong preference for the rail option and opposition to paving a road on the Country Club right-of-way for buses.
I also get the sense that people who were the most interested in the plan were focused on their nostalgia for streetcars or an obsession with repurposing freight railways for public transit use – ideas that represented a tragic recent mistake or some magic, low cost solution that could be built over night. I don’t have hard proof that this was the case, but in my own personal experience, if you ask people to think a little bit more critically about the failure of privately-owned street railway companies (which failed because they operated under a speculative real estate model that eventually collapsed, rather than a public utility), or about the use of private rail rights-of-way (which are typically not providing useful infrastructure, but just difficult-to-negotiate right-of-way in only sometimes useful places), they usually just walk away out of boredom.
The Independence Mayor Richard King opposed the rail plan and wanted more bus service for his own city. His major concern was that the I-70 rail alignment was too far south to make a big difference for much of his community, and there wasn’t enough bus service for the area north of Independence. A pamphlet from earlier in the planning process shows 6 distinct corridors covering 74 miles. The east corridor looks like it covered a bit more of northeastern Independence. While this map probably gave UMTA planners heartburn, it also probably had better regional political appeal.
Kansas City’s Mayor Charlie Wheeler made for a halfhearted champion, at least at this point in his life. In the Star’s major feature on the plan, his support is somewhat reserved. He says that reducing fares would be better at attracting riders than making substantial investments in the quality of the service. In searching for some news articles about the plan, I also stumbled across an article from April 1974 about the failure of 10 bond items, which require a 2/3 majority to pass. Mayor Wheeler and other officials lamented the “negative period” the city had entered (Mayor Wheeler also blamed striking labor unions and the election board, which both seem like deflection). The electorate’s more negative outlook may have been a big part of the reason major transit funding wasn’t pursued. This particular loss may have had a chilling effect on Mayor Wheeler and politicians that followed. It’s not necessarily the case that any proposal before voters would have failed. Similarly, Mayor James wasn’t willing to revisit the Streetcar Expansion after the 2014 failed TDD vote. Losing is hard, and politicians try to avoid doing it more than once.
Double standard of rational planning: The forces that set off the trend of hollowing out the urban core, promoting sprawl, and building highways followed a different set of rules than what were used in this transit proposal. Urban renewal programs were haphazardly implemented with little regard for local stakeholders. The same is true of highway building. None of these projects fit within their original budgets or scope, and they certainly didn’t deliver on their promises.
That same double standard holds today. Transit, bike/pedestrian projects, and urban infill are largely expected to be rational and are heavily scrutinized, with planning and evaluation efforts that can span years or even a decade. Highway projects and environmentally degrading greenfield development, on the other hand, occurs under a business as usual assumption. The laws and planning framework for sprawl and automobile dependency are weak to the point of non-existence.

The Streetcar Neighbors Era
There were really very few investments in transit capital or increased service since that time, although there were many attempts. The region eventually built two enhanced bus lines (albeit without signal priority or exclusive lanes) through the Very Small Starts and Small Starts Capital Investment Programs in the 2000s and early 2010s. The major capital program breakthrough came from the downtown streetcar starter route. While there was a rational planning process that led to the selection of the streetcar as a preferred alternative, it was the mobilization of downtown residents – notarizing mail-in ballots in one another’s living rooms – that made the plan a reality. Again after a failed vote to expand the streetcar in 2014, when City elected officials refused to push the issue again, private petitioners mobilized via the Kansas City Regional Transit Alliance to extend the streetcar to UMKC.
I wonder what the 1975 Kansas City Transit Associates would have said about the downtown streetcar. They might recognize their work in some of the corridors being constructed or considered today – the Main Street Extension, North Rail, and the East-West Transit Corridor, albeit these are projects with a decidedly different mode. In any event, the current approach of funding capital projects with hyper-local value capture models (the Transportation Development District) is reaching its limits. As advocates and planners hope to build transit projects throughout the broader region, what lessons can we learn from the 1975 Transit Plan effort?
Lessons for Today
Solve the Operations Challenge
It’s hard for a lot of people to wrap their heads around the cost of operations, which receive very little Federal government subsidy. In 2021 the average transit vehicle in the US cost $203 per hour of revenue operations (a typical US bus averaged $160, and a typical streetcar averaged $304). A typical month of service for KCATA is over 40,000 revenue hours. To give a sense for the scale of operating cost, the capital cost of the Main Street streetcar (Kansas City’s largest capital transit investment in history at $352 million) will be eclipsed by region’s total transit operating costs in about 5 years – and almost all of that money will have been generated locally. The 1975 plan proposed around 2.7 million revenue hours of bus service, not including the fixed guideway or dial-a-ride service. Before the pandemic in 2019, all modes in Kansas City operated just shy of a million vehicle revenue hours, and fixed route services (local bus, BRT, and streetcar) had about 700,000 revenue hours.
The cost for an hour of transit service increases every year, even when controlling for inflation. The cost of bus service in KC is about at the national average. I omitted recent NTD data from the pandemic era (2020 and 2021). This data is for fixed route bus service operated by the KCATA and as compared to the national average.
At the time of this study, transit fares in Kansas City were around 40 cents per trip ($2.34 today), and a bus cost around $9.40 per vehicle per hour to operate ($55.05 in today’s dollars; that’s much lower than today’s actual operating costs). The annual operating cost was projected to be $60-61 million per year (about $357 million in today’s dollars), but with $32.5-36.8 million ($190-$216 today) in fare revenues, representing a farebox recovery rate as high as 60%, which is as high as some of the most efficient systems in the US today. This view was likely too optimistic for the planned system and external forces, but it’s at least nice to see planning that was ambitious enough to assume that transit would be successful enough that it could generate so much ridership.
I don’t want to devote too much time discussing the impact of eliminating fares in Kansas City. I am glad Kansas City tried this, and the timing seems like it was very beneficial to riders struggling during the pandemic. I have noticed that I am much more likely to hop on a bus spontaneously if the timing works out. I’ve also noticed how much faster boarding is compared to a time when we had on-board fare payment. You could certainly debate the sustainability of this zero fare transit in Kansas City versus regions that would have far higher fare revenues to offset. You can also debate the value of eliminating fares for an estimated cost of $8 million versus the value of increasing service by that same amount. Being able to travel more places by bus, or not having to wait as long for a bus could drive ridership growth and be a real improvement for people who rely on transit. Personally, I think we should be investing in a system with service good enough to pay for. That doesn’t mean I don’t think free or reduced fares shouldn’t be a thing for certain groups. Prior to universal free fare, students, veterans, and lower-income individuals all received free or reduced fares.
The impact of increasing service on ridership is pretty clear. In 2003 (the dashed line in the graph), Kansas City voters authorized a new 3/8 cent sales tax for additional transit service, which they renewed in 2008 and will be asked to renew this November. As revenue was collected, service ramped up and ridership followed. After the 2008 Great Financial Crisis there were certainly macroeconomic headwinds to transit ridership, but ridership would have been far worse without the additional service. This graph includes bus, BRT, and streetcar modes in the Kansas City Urbanized Area.
Regardless of whether Kansas City continues to offer fare-free transit, it’s clear that transit will need substantial subsidy to operate. The bottom line is this: until the Kansas City region can generate a significantly higher and more consistent subsidy for operations, transit won’t improve much.
Capital projects as an anchor
While operating subsidy is the most critical issue for planners to solve in the region, we can’t forget the transformational role that major capital projects can play. The downtown streetcar is an illustrative example. It became a tangible goal that motivated downtown residents to organize, forming the Streetcar Neighbors coalition that resulted in the formation of a local taxing district. It catalyzed billions in new development, outpacing many other areas as the region recovered from the great financial crisis. Despite being just two miles in length, it has become an essential part of the City’s fabric, and it has changed Kansas Citians’ understanding of how they can navigate downtown. While many would be loath to walk even a couple of blocks from a parking space prior to the streetcar, the predictability of the service has helped automobile-addicted visitors to downtown get out of their cars. Perhaps the most telling sign of the streetcar’s impact on the urban environment downtown was its absence when an unexpected rail failure caused a shutdown spanning multiple weeks, downtown was noticeably less vibrant and functional. Finally the streetcar’s capital investment was closely integrated with the operating model. The financial model fully subsidized the cost of frequent operations that are well-tuned to the cadence of downtown activity. Some capital investments in ITS infrastructure help speed the streetcar up, which means more service can be provided for the same operating cost (I would also argue that the City could further improve operations by limiting automobile access at several points along the route, but that is a longer post).
To summarize, capital projects can help by:
Mobilizing supporters around a tangible goal. Whether this is a core group of nerds that just like trains or other transit infrastructure, or vested interests that build it, capital projects have a way of creating a goal that people can understand and rally behind. So much of the force behind highway building is not a rational need for more road capacity, but pressure from the industry to keep building. As a result we’ve become really good at building highways. That same motivation can work toward transit’s benefit as well. Having a continuous pipeline of funded transit projects rather than the current intermittent model will help establish a skilled construction workforce, attract attention from experienced firms that can help create more competition, and build local agency capacity to manage, design, and deliver transit projects.
Catalyzing infill development. The scale and quality of development respond to the amount and character of infrastructure that we build to support it. Highways had the effect of replacing farmland and natural habitat with more suburbia. Transit has the effect of spurring development by providing new amenity value and reducing some of the private costs of development, like off-street parking. Real estate markets aren’t perfect, of course, and many projects require intentional planning and policy to make them work well. I will try not to be too negative, but far too many transit-adjacent infill projects are over-parked and reward land speculators who were able to sell property at a premium. But transit does help create opportunities for more progressive projects that would have been unthinkable in other circumstances.
Becoming a focal point of the urban experience. Transit capital projects transform the public realm and the way we move through it. The subway in New York, the L in Chicago, streetcars in the neutral ground in New Orleans, trolleybuses in Seattle or San Francisco, modern streetcars in Kansas City or Cincinnati, and the Red Line BRT in Indianapolis all establish a fundamental connection between mobility and place. Transit projects also act as a fundamental element of a democratic society. By providing access to anyone, without need for their own private investment in an automobile, we are making a statement about equality and belonging in society.
Reducing operating costs. Perhaps the most useful and rational thing capital spending can do for transit is reduce its overall operating cost. Federal grants for transit capital is abundant, but basically unheard of for ordinary operations. But by investing in technology that speeds up transit, agencies can transmogrify capital dollars into operational savings. That could be as advanced as a fully automated light metro system (Vancouver’s SkyTrain, an automated and frequent light metro system, has operating costs per vehicle revenue hour comparable to a bus) to more modest features like level boarding, transit lanes and queue jumps, and transit signal priority. For transit operations, time is money, so speeding up transit has the dual benefit of allowing an agency to run more service for the same amount of money and getting riders to their destinations more quickly.
Looking to the Future
Transit is at an inflection point in our region and across the country. While there is a fiscal crisis facing many agencies that requires swift action from politicians, there is also an opportunity to start to define what transportation looks like in the recovery from the COVID-19 pandemic, shifting from commute-focused transportation planning to a more complete understanding of why and how transit can serve more trip purposes. Bus ridership has fully recovered to 2019 levels, which is pretty good evidence to me that you don’t always need centrally-located office workers for decent transit ridership.
The region has the 2026 World Cup on the horizon, which is a good excuse to invest in useful transit that will outlive the event. I think this event also generally helps boost our civic self esteem and helps residents and voters feel like they deserve nice things, like a convenient transit system.
Congress increased its infrastructure spending through the Infrastructure Investment and Jobs Act and Inflation Reduction Act, which could be a major boost to transit capital projects. But these grant programs require a local match, don’t come up with operating funds, and are awarded based on the competitive merits of a project. Transit infrastructure costs have also been soaring, so there’s a need to be sensible and realistic about what can be developed, and maximize the value of whatever projects we pursue. If Kansas City does sustain capital investment, it can realize much cheaper transit projects in the future.
Just this week, the City Council approved ballot language to renew a critical 3/8 cent sales tax. This was not a given two weeks ago. There is a growing chorus of voices calling for other jurisdictions to increase their transit funding.
Regional transit funding would allow for sustainable, cross-border transit operations in a way that’s currently not possible. Recently, Gladstone’s City Council voted to end fixed route service in their city due to their own funding constraints and the increasing cost of service, which was historically subsidized by the City of Kansas City. A more regional model could prevent this sad situation from occurring in the future. It could also make day-to-day service planning less parochial and more responsive to riders’ actual needs.
Regional transit funding can do a lot more than help save existing service, too. It can transform the city for the better, creating a more equitable, climate resilient, and economically energetic region. We should be ambitious about funding transit, or else risk the same failures over the past several decades. To do that, the region needs a transit plan with similar effort and ambition of the 1975 plan, but with the benefit of hindsight and the energy of the current moment in Kansas City. The plan should be developed with the expectation that we would eventually ask voters to tax themselves to pay for more transit.
Below is my opinionated list of what an ambitious transit proposal should include.
1. Triple transit service (at least)
Regional funding should triple transit service in the region from 2019 levels. Back-of-the-envelope math shows that the 1975 transit plan was actually proposing 4x the amount of fixed route service as in 2019, so this is actually a modest proposal by comparison. The most efficient way to grow the region’s transit ridership is to add new fixed route bus service by increasing service on existing routes and developing new routes in underserved parts of the region. Implementing frequent service on all of the region’s proposed Fast and Frequent routes should be a top priority.
| Route | 2023 Headways | Current Mode | Future Plan Status |
|---|---|---|---|
| Main Street (Downtown) | 8-12 min. | Streetcar | |
| Main Street to Plaza | 20 min. | MAX | Streetcar Under Construction |
| Troost | 20 min. | MAX | |
| Prospect | 15 min | MAX | |
| Independence Avenue | 30 min. | Local Bus | MAX Feasibility Study Completed |
| 31st Street | 15 min. | Local Bus | MAX or Streetcar; Feasibility Study Underway |
| 39th Street | 30 min. | Local Bus | MAX or Streetcar; Feasibility Study Underway |
| North Oak Trafficway | 30 min. | Local Bus | Streetcar (partial); Feasibility Study Underway |
| State Avenue | 60 min. | Local Bus | |
| 7th/Rainbow | 60 min. | Local Bus | |
| Metcalf | 30 min.* | Local Bus | |
| 75th/Quivira | 70 min. | Local Bus |
Local bus service could be planned and implemented based on local preferences and community engagement, but there should be a regional service standard that establishes service spans, headways, and stop spacing for different service types and land use contexts. I also think a network of frequent, all-day suburban express buses into downtown Kansas City would serve the region well, and get more jurisdictions on board with regional transit funding. While this certainly benefits downtown, with coordinated arrivals and departures from a downtown transit hub, it would be possible for someone to traverse the entire region on transit in a way that isn’t possible today.
2. Create a compelling transit capital program
A regional transit funding source should fund a compelling transit capital program that introduces new modes and technologies. So far, Kansas City has come to know mixed traffic streetcars and lighter implementations of Bus Rapid Transit. Our three MAX routes and Streetcar extensions were significant efforts and have done a lot of good for the corridors they support.
Continuing to build out and enhance these modes in other corridors makes sense in the short term, and regional funding would allow us to sustain the workforce and technical capacity required to keep costs reasonable. Regional funding could provide a match to Federal dollars for NorthRail and the East-West transit project. Other Fast and Frequent MAX routes could also be built. The City’s recent decision to study exclusive transit lanes for Main Street is an exciting development, and it sets the tone that future transit capital projects should, well, prioritize transit. While the MAX model has been successful locally, the region could also look to other BRT routes like IndyGo’s Red Line when it comes to building enhanced bus corridors.
While the existing, under-construction, and proposed streetcar routes would make for a lovely network serving the city’s historic urban core, the region should also begin to explore other rail modes for the longer term. I would skip conventional light rail as it has been implemented in other cities, where capital and operating costs have grown considerably without strong mobility benefits. A speedy light metro system like the one originally contemplated in the 1975 plan would fundamentally transform Kansas City for the better. Systems like Honolulu’s Skyline, Vancouver’s SkyTrain, or Montreal’s REM all come to mind as similar modes that Kansas City should aspire to. A regional rail network extending further into the suburbs, which could be an integrated or separate system, should also be a part of a longer-term regional vision.
The capital program should also help improve biking and walking infrastructure, including developing complete streets around transit and building out the region’s trail network. Kansas City and other cities in the region have built several great complete streets projects. Kansas City has been focused on a quick-build approach to complete streets, focused on implementing road diets and on-street protected bicycle facilities as streets are resurfaced. With some additional funding, today’s quick-build network could become tomorrow’s cherished urban trails. Dedicated regional funding could help build out the MetroGreen network or other locally-determined trail priorities. It would also be a reason for voters in outlying areas to support a transit tax that they might not otherwise benefit from.
3. Transform the Region’s Broken Land Use
It’s important to fund transit throughout the region, but even with additional service, transit can’t continue to chase low-density employment and population centers. We should be shocked by just how destructive sprawl was (even more destructive than planners predicted in a pessimistic scenario) to the region over the last half century. And it’s clear from recent experience that the land value premium transit provides doesn’t solve all of the challenges around infill. Policy and regulatory reforms are needed to improve the quality of infill and the pace it gets built.
But to really make an impact, a regional transit funding source should devote some direct funding to transit-oriented development and affordable housing. This could take different forms in different places. In a suburb, it might mean redeveloping a dead mall on a suburban corridor into missing middle housing. For Kansas City, it could mean creating municipal social housing demonstration projects that add much-needed affordability to transit corridors. Direct funding could leverage incentives and financing/credit programs (including Federal credit programs like TIFIA) to help a modest amount of funding go further. While it would certainly require the public sector to develop institutional capacity, direct funding would allow the public sector to develop or procure TOD projects on their own terms that better align with their policy goals in a way that most incentives programs aren’t currently able to. Direct funding for transit-oriented development would provide some of the subsidy needed to produce more affordable housing. It could also demonstrate the feasibility of various design and development strategies to the risk averse private sector (especially as it relates to parking, which is a major issue on most infill projects).
Concluding thoughts
It’s tempting to sulk and think about what could have been when reviewing past transit proposals. But we have the benefit of learning from past failures and applying them to our own present-day efforts. The timing is right for regional transit funding in Kansas City. We need technical professionals and elected leaders to come together to develop a tangible and compelling vision for Kansas City’s transit future.
If you’ve made it this far, thanks for reading. As always, this work just represents my personal opinion. I’d love to hear your thoughts as well. Feel free to reach out at hello@joshboehm.xyz if you want to chat more about this topic.